Previous Post
- September 26, 2026
How to Evaluate LIHTC Feasibility Software Using One Real Deal
In 2026 the 9% credit got the largest allocation increase in the program's history. The One Big Beautiful Bill Act permanently raised the annual 9% ceiling 12%, and after Treasury corrected an initial revenue procedure that had left the increase out entirely, the corrected 2026 per-capita multiplier landed at $3.416, with a small-state minimum of $3,953,600. On paper, that's the biggest single expansion of competitive credit authority the program has seen. On the ground, it hasn't made the math on any individual deal noticeably easier.
That's the paradox worth sitting with before doing anything else: more credit authority is flowing into the system than ever, and developers are still walking away from competitive rounds empty-handed at roughly the same rate they always have, while every other line on the sources and uses tab — construction cost, permanent debt, even the price an investor will pay for the credit itself — has moved in the wrong direction over the same period. A bigger ceiling doesn't close a gap it never touched.
California is a useful place to see this directly, because CTCAC publishes its numbers. In 2025, developers filed 72 applications for the state's first 9% round and 69 for the second — 141 total — competing for a federal ceiling of roughly $118 million. CTCAC ended the year having allocated $115.5 million to 58 projects, just under 3,000 units, out of a competitive field more than twice that size. Other states show the same shape at different scale: Indiana's 2024 competitive round drew 35 applications for 17 awards, close to half funded; Louisiana's most recent round drew 40 applications for 12, under a third.
That's expected in a sense — a 12% increase in available credit doesn't mean 12% more deals clear scoring, because the pool of sites and sponsors trying to compete keeps expanding too. But it means a developer can't treat "credits are more available now" as license to relax the underwriting. The odds of winning a specific 9% round in 2026 are not meaningfully better than they were before OBBBA, even though the total dollars on the table are larger.
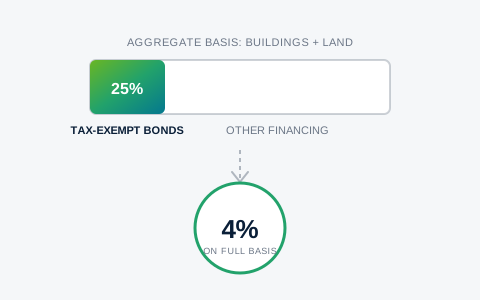
The reason the bigger ceiling hasn't translated into an easier close is that it landed on the demand side of the equity market at the same time. Pushing more 9% volume into the pipeline — plus permanently lowering the private-activity-bond "financed-by" test from 50% to 25% of aggregate land and building costs for 4% deals placed in service after December 31, 2025, a change Novogradac estimates could help finance 1.22 million additional affordable rental homes over 2026 through 2035 — means a larger supply of tax credits chasing a roughly unchanged pool of investors willing to buy them.
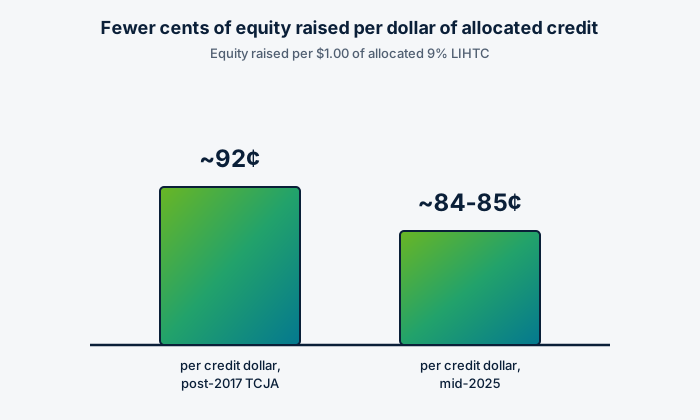
Equity pricing has absorbed that. Novogradac's tracking puts the national average bid for both 9% and 4% credits at roughly 84 to 85 cents per credit dollar as of mid-2025, down from about 92 cents in the period right after the 2017 Tax Cuts and Jobs Act — and pricing has been getting less predictable as it's gotten cheaper, with per-deal quotes spreading out rather than clustering near the average. Novogradac Chief Public Policy Officer Peter Lawrence has put the stakes plainly: a further cent or two of price decline could "make a few properties financially infeasible." A 9% award that would have raised a given dollar amount of equity in 2019 raises less in 2026, before a single cost line on the project has moved.
They've moved anyway. Multifamily construction inflation ran 3.3% to 4.7% annually through 2024 and 2025 on the Turner Building Cost Index, and industry reporting attributes a push above 4% in 2025 specifically to tariff pressure on materials. A TD Bank survey of 238 affordable housing professionals in November 2025 found 55% naming high construction costs as an ongoing barrier to development, 50% citing federal policy changes, and 39% citing tariff-driven price increases directly.
Debt hasn't offered relief either. As of August 26, 2026, Freddie Mac's posted large-balance multifamily rate for a 10-year fixed loan sits at 5.84%, and the small-balance product — loans under $10 million, which covers a lot of affordable deals — runs higher, at 6.17%. On a restricted-rent property, where net operating income is capped by AMI-based rent formulas rather than set at market, that rate directly limits how much senior debt the deal can support, which is exactly the gap the subsidy stack exists to fill. The need hasn't shrunk in the meantime: NLIHC's Gap 2026 report puts the national shortage at 7.2 million affordable and available rental homes for extremely low-income renter households, or 35 such homes for every 100 households that need one.
Put those pieces together and a specific deal's 2026 funding gap usually isn't solvable by turning one dial. Equity is worth less per credit dollar than it was, so the deal may need a QCT/DDA basis boost to 130% of eligible basis under IRC Section 42(d)(5)(B) to generate enough eligible basis in the first place. Debt is more expensive, so the AMI mix that maximizes QAP scoring points isn't necessarily the AMI mix that maximizes supportable senior debt — those two objectives now pull against each other more often than they used to. And with the PAB financed-by test down to 25%, a site that would have been underwritten as a 9% competitive deal two years ago might close faster and pencil better as a 4%-plus-bond deal now, but only if that state's current bond volume and QAP scoring actually support the swap for that specific site.
None of those variables move independently. Changing unit mix changes total development cost, which changes the size of the gap, which changes how much soft money the deal needs, which changes which QAP-scored soft funds it's even competitive for. Testing that by hand — one spreadsheet variant at a time, changing one assumption, re-running sources and uses, checking it against scoring criteria, then trying the next combination — is why subsidy layering is usually the single most time-consuming part of underwriting a LIHTC deal. A team can realistically test a handful of scenarios before a submission deadline. The combination that actually closes the gap on a given site is rarely one of the handful anyone thought to try first.
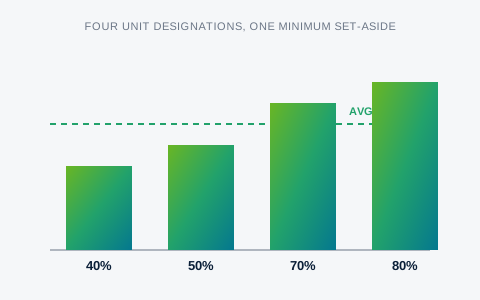
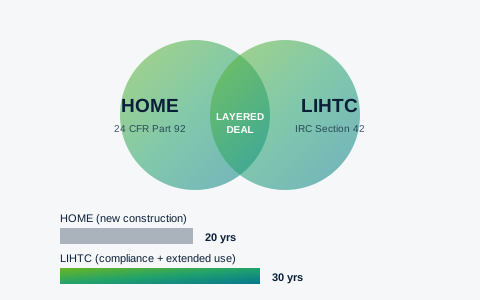
EZFeasi's Subsidy Stack Optimizer is built for exactly that combinatorial problem. It layers LIHTC equity, HOME and Housing Trust Fund dollars, state QAP-scored soft funds, and bond financing against a site, then runs the unit-mix and financing scenarios systematically — AMI-designation swaps, density changes, credit-type swaps between 9% and 4%-plus-bond, and basis-boost elections — instead of testing them one spreadsheet tab at a time. On a real Riverside County run, the engine evaluated the full space of legally permissible AMI-designation combinations for a site and found that 268 of the 343 combinations qualified under the applicable rules, a range no analyst is checking by hand before a deadline.
The point isn't that every one of those 268 combinations closes the gap — most won't. It's that the one combination that does is far more likely to turn up when the software checks all 343 than when a team checks the six it had time for.
Use the applicable agency documents and funding-year requirements when evaluating a project.
Topic: