Previous Post
- September 29, 2026
The Average Income Test: LIHTC's Third Minimum Set-Aside, Explained
Ask most people how a project gets '4% credits' instead of '9% credits' and the answer usually stops at 'it's not competitive.' That's true, but it skips the actual mechanism, and the mechanism is worth understanding because it runs through an entirely separate federal allocation system: tax-exempt private activity bonds, governed by a volume cap that has nothing to do with the Low-Income Housing Tax Credit program on its own.
A 4% deal isn't awarded by a housing finance agency picking it from a competitive pool the way a 9% deal is. It qualifies automatically -- 'as of right,' in industry language -- the moment it clears a financing test tied to how much of the project is paid for with tax-exempt bonds. Understanding that test, and the bond volume cap that makes bonds scarce enough to matter, explains why 4% deal flow moves on a completely different rhythm than competitive 9% rounds.
Tax-exempt private activity bonds are capped nationally under Internal Revenue Code Section 146. Each state gets its own annual volume cap -- an amount of tax-exempt bond authority it can allocate that year across every private-activity use the tax code recognizes, not housing alone. That list includes exempt facility bonds for airports and solid waste facilities, qualified student loan bonds, small-issue manufacturing bonds, and multifamily housing bonds, all drawing from the same statewide pool.
The cap itself is set by a per-capita formula with an inflation-adjusted floor for small states, both published annually by the IRS. For calendar year 2026, Revenue Procedure 2025-32 sets the amount at the greater of $135 per state resident or a $397,625,000 floor -- so a state's total bond authority for every private-activity use combined, housing included, is either its population multiplied by $135, or roughly $398 million, whichever is larger.
Multifamily housing bonds compete against every other private-activity use for a slice of that same statewide number. In states where bond demand runs high across all categories, the housing bond allocation itself becomes the practical constraint on how many 4% deals a state can close in a given year -- independent of how much 9% credit authority that same state has.
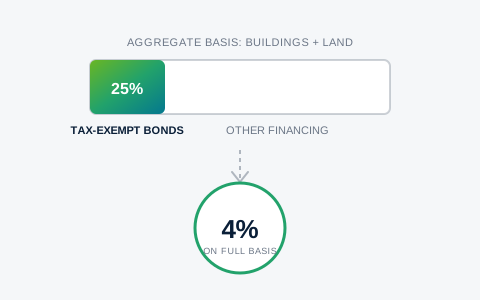
Volume cap explains why bonds are scarce. It doesn't explain why bonds produce a 4% credit at all. That mechanism sits in Internal Revenue Code Section 42(h)(4)(B): if a specified share of a project's aggregate basis -- the buildings and the land under them -- is financed with tax-exempt bonds that count against volume cap, the entire eligible basis of the project qualifies for 4% credits without going through a state's separate competitive 9% allocation process.
For decades that specified share was 50%. A sponsor had to finance at least half the project's total basis with bonds to unlock 4% credits on 100% of eligible basis -- a real capital commitment, since every dollar of bond financing used to hit that 50% floor draws on the state's scarce, often-oversubscribed volume cap.
The One Big Beautiful Bill Act (OBBBA), signed July 4, 2025, cut that threshold from 50% to 25% of aggregate basis, for bonds issued and buildings placed in service after December 31, 2025. It's a permanent statutory change, not a temporary allowance.
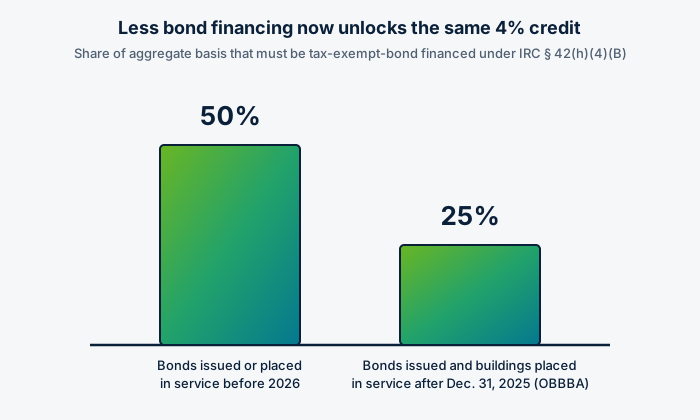
The effect isn't just 'less bond financing required.' Because the 50% test had pushed housing bond demand close to the ceiling of available volume cap in a number of states -- industry commentary from Lument, an LIHTC-focused capital provider, has described the pre-2026 50% level as leaving housing bond demand 'nearly maxed out' and oversubscribed in roughly half the states -- a lower financed-by threshold means the same fixed pool of volume cap can now support meaningfully more total development cost in 4% deals than it could before, since each project only needs to draw a quarter of its basis from bonds rather than half.
There's a real tradeoff underneath that gain, worth naming rather than treating the change as a pure win. A sponsor that draws only the minimum 25% in tax-exempt bonds has to finance the remaining three-quarters of the capital stack some other way -- often with taxable debt, which the same industry commentary notes typically prices roughly half a percentage point higher than tax-exempt bonds. Freed-up volume cap doesn't automatically mean cheaper financing on any single deal; it means more deals can compete for the bond allocation that exists, and each sponsor still has to decide whether to draw the statutory minimum or a larger bond share to manage its own cost of capital.
This financed-by change landed in the same legislative package that permanently raised the annual 9% credit ceiling, and the two changes pull on the funding-gap math from different directions -- we've covered the 9% side of that story, including why a bigger ceiling hasn't made individual deals easier to close, in a separate look at the 2026 LIHTC funding gap. The short version that matters here: a site that would have been underwritten as a competitive 9% deal two years ago may pencil faster and more predictably as a 25%-test 4% bond deal now -- but only if that state's current bond volume and QAP scoring for bond deals actually support the swap, which is a state-specific, deal-specific question, not a blanket rule.
Testing whether a site is better underwritten as a 9% competitive deal or a 25%-test 4% bond deal means running both financing structures against the same site and comparing the results, rather than assuming the answer based on which credit type a sponsor has used before. EZFeasi's Subsidy Stack Optimizer models both credit-type paths side by side, so the comparison happens before a state's bond allocation or 9% round closes, not after. Book a demo to walk through how a specific site compares under each.
Use the applicable agency documents and funding-year requirements when evaluating a project.
Topic: